
The Hidden Impact of Sensor Placement in Wearable Devices: How PPG and ECG Shape Wearable Design
- Madhura R
- 2 days ago
- 15 min read
Sensor placement is one of the most important design decisions in wearable product development because it directly affects the accuracy of PPG (photoplethysmography) and ECG (electrocardiography) measurements. Different parts of the body produce different physiological signals, influencing everything from heart rate and SpO₂ accuracy to ECG signal quality, PCB layout, power consumption, and mechanical design. This article explains how body location shapes wearable engineering, why the wrist, finger, and chest each have unique advantages, and how engineers optimize PPG and ECG systems to deliver reliable health monitoring in compact wearable devices.
Wearable devices have become an integral part of modern health monitoring. What began as simple fitness trackers capable of counting steps has evolved into sophisticated systems that continuously monitor heart rate, blood oxygen saturation (SpO₂), electrocardiograms (ECG), skin temperature, sleep quality, stress levels, respiratory patterns, and physical activity — all from devices small enough to comfortably fit on the wrist, finger, chest, or ear.
From the outside, it almost seems effortless. Wear the device, wait a few seconds, and your physiological data starts appearing on the screen. Behind that seemingly simple experience, however, lies an incredibly complex engineering problem.
Modern wearables pack an extraordinary amount of technology into an extremely compact form factor. Optical sensors, analog front ends (AFEs), inertial measurement units (IMUs), wireless SoCs, antennas, batteries, charging circuits, power management systems, and sophisticated embedded algorithms must all work together within a device expected to be lightweight, comfortable, power efficient, and reliable enough for continuous wear.
With sensors becoming smaller, more sensitive, and more power efficient every year, it's easy to assume that building a better wearable simply comes down to selecting better components. In reality, one of the most important design decisions is made long before the first schematic is drawn or the PCB is routed.
Where on the body will this device be worn?
At first glance, it seems like a simple question. After all, if the goal is to measure heart rate, why not place the sensor wherever it fits inside the enclosure? The answer is surprisingly complex.
The human body is far from being a uniform sensing environment. Blood perfusion varies significantly between the wrist and the fingertip. Electrical signals generated by the heart are strongest near the chest. Skin thickness, tissue composition, sweat gland density, and movement patterns all change across different parts of the body. As a result, the same sensor can produce very different results depending on where it is placed.
Take optical sensing as an example. The fingertip provides excellent PPG signals because of its rich vascular network, making it the preferred location for clinical pulse oximeters. Consumer wearables, however, typically measure from the wrist — a location with deeper blood vessels, lower perfusion, and significantly more motion. Similarly, the chest remains the preferred location for ECG, yet integrating ECG into compact everyday wearables requires an entirely different design approach.
If the finger provides a better optical signal and the chest provides a better ECG signal, why aren't all wearables designed around these locations?
Because wearable design isn't simply about finding the strongest physiological signal. It's about balancing measurement quality with comfort, battery life, device size, aesthetics, manufacturability, and long-term wearability. Every body location solves one problem while creating another, turning wearable development into a continuous exercise in engineering trade-offs.
This is the hidden impact of sensor placement. It doesn't just determine where a sensor sits, it shapes the sensing technology, hardware architecture, PCB layout, mechanical design, thermal management, antenna integration, power consumption, and ultimately how well the final product performs.
Throughout this article, we'll explore how the choice of body location influences some of the most common wearable sensing technologies, including heart-rate monitoring, SpO₂, ECG, sleep tracking, stress monitoring, motion sensing, and skin temperature measurement. More importantly, we'll look beyond the sensing principles to understand how each measurement drives the engineering decisions behind it: from component selection and PCB layout to overall product performance.
Because in wearable technology, one of the most important engineering decisions isn't choosing the sensor.
It's deciding where that sensor meets the human body.

Why the Human Body Isn't a Uniform Sensing Platform
One of the biggest misconceptions about wearable sensing is that a physiological parameter can be measured equally well from anywhere on the body. If that were true, designing wearables would be much simpler: pick the required sensor, place it wherever space is available, and start collecting data.
In reality, every part of the human body presents a completely different sensing environment. The wrist, finger, chest, ear, and upper arm may all seem like convenient locations to wear a device, but beneath the skin they differ significantly in anatomy, blood flow, tissue composition, temperature, and movement. These differences directly affect the quality of the physiological signals available for measurement and, consequently, the engineering decisions required to capture them reliably.
Take blood perfusion, for example. Some areas of the body have a dense network of superficial blood vessels, producing strong pulsatile signals that are ideal for optical sensing. Other locations have deeper blood vessels and thicker layers of tissue, causing the optical signal to weaken before it reaches the photodetector. This is one of the primary reasons a fingertip produces a much stronger PPG signal than the wrist, even though both measure the same cardiovascular activity.
Electrical measurements follow a similar pattern. ECG signals originate from the electrical activity of the heart, making locations closer to the chest naturally more suitable for capturing high-quality waveforms. Increasing the distance from the heart or reducing the spacing between electrodes doesn't eliminate the signal, but it does introduce new design challenges related to signal amplitude, noise, and electrode contact.
Unlike clinical monitoring systems, wearable devices are expected to function while users walk, exercise, sleep, work, and go about their daily routines. Every movement changes the interaction between the sensor and the skin. Optical sensors are highly susceptible to ambient light leakage and to motion artifacts resulting from changes in sensor-to-skin contact pressure, while ECG electrodes can be affected by variations in skin contact, skin impedance and muscle activity. Even an IMU mounted on the wrist experiences very different motion characteristics compared to one positioned on the chest or waist.
Then there are factors that are often easy to overlook. Skin thickness varies across the body and even between individuals. Sweat alters the electrical properties of the skin and can influence both optical and electrical measurements. Local temperature affects blood circulation, while body hair, skin tone, and the way a wearable fits all contribute to measurement quality.
None of these factors exist in isolation. Instead, they interact with one another, creating a sensing environment that is constantly changing throughout the day.
This is why wearable design is rarely about finding the perfect measurement location. Instead, it is about understanding the strengths and limitations of each body location and designing a system that performs reliably despite them. The best physiological signal may not come from the most practical location, and the most comfortable location may require additional hardware and software techniques to compensate for weaker signals. This balance between physiology, engineering, and user experience is what drives the design of every wearable device. Whether the goal is measuring heart rate, ECG, sleep, stress, motion, or skin temperature, the same principle applies: Where you measure is just as important as what you measure.

Choosing the Right Wear Location: The First Design Decision
By now, it's clear that every body location offers a different sensing environment. The next question is equally important: How do engineers decide where a wearable should actually be worn?
At first, the answer might seem obvious. If a particular location provides the strongest physiological signal, shouldn't that always be the preferred choice?
In practice, the decision is rarely that straightforward.
Wearable design is a balancing act between physiology, engineering, and user experience. The location that provides the best signal is not always the location people are willing to wear every day, and the most comfortable location often presents the greatest engineering challenges.
Take heart-rate monitoring as an example. The fingertip offers one of the strongest PPG signals because of its rich vascular network and high blood perfusion. This is why clinical pulse oximeters almost always measure from the finger. Yet consumer wearables overwhelmingly measure from the wrist. The signal may be weaker, but the wrist is a location people are already familiar with through watches and fitness bands, making it practical for continuous monitoring.
The same trade-off appears in ECG monitoring. Clinically, the chest provides the most direct measurement of the heart's electrical activity. However, wearing adhesive electrodes throughout the day is impractical for most users. This has driven the development of alternative solutions such as smartwatches and smart rings that capture ECG through brief user interactions rather than continuous monitoring.
Even motion sensing demonstrates this compromise. An IMU mounted near the body's center of mass can provide highly representative movement data, yet wrist-worn devices remain the most common because they fit naturally into everyday life.
In other words, wearable design rarely starts by asking, "Where is the strongest signal?"
Instead, it asks, "Where can we obtain a reliable signal from a location that people are willing to wear?"
Once that decision has been made, everything else begins to follow.
The available physiological signal determines the sensing technique. The sensing technique influences the choice of sensor and analog front end. Those decisions shape the PCB layout, mechanical design, battery capacity, antenna placement, thermal strategy, enclosure design, and even the software algorithms required to compensate for real-world conditions.

Designing a Reliable Optical Sensing System: Building a PPG System That Works in the Real World
On paper, designing a PPG system looks surprisingly simple: Take an LED, place a photodiode next to it, shine light into the skin, measure the reflected light, and you've got yourself a heart-rate sensor.
If only it were that easy.
Photoplethysmography (PPG) has become the backbone of modern wearable health monitoring. Using a combination of LEDs and a photodiode, a single optical sensing system can continuously monitor heart rate (HR), heart rate variability (HRV), blood oxygen saturation (SpO₂), respiratory rate, and even provide valuable insights into sleep quality and stress levels through advanced signal processing. Because so many health metrics rely on the same optical sensor, the quality of the captured PPG signal directly influences the accuracy of every feature built on top of it.
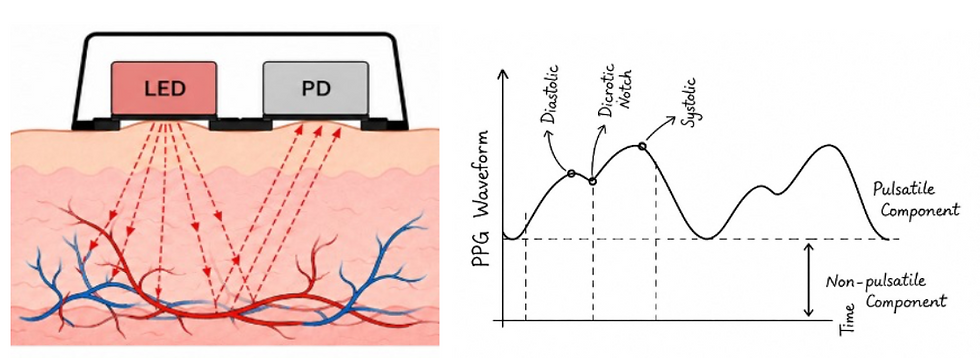
At its core, the sensing principle is relatively simple. The LEDs illuminate the skin while the photodiode measures the light reflected back from the tissue. As blood volume changes with every heartbeat, the amount of reflected light changes as well, producing the characteristic PPG waveform that forms the basis of these physiological measurements.
The real challenge, however, isn't understanding how PPG works.
It's designing an optical sensing system that can capture this tiny physiological signal accurately while dealing with motion, ambient light, electrical noise, power limitations, and the space constraints of modern wearable devices. That's where the engineering begins.
Choosing the Right Wavelength
One of the first questions designers face is surprisingly simple: "Which LED should I use?"
The answer depends entirely on what you're trying to measure.
Different wavelengths interact differently with biological tissue. Some are absorbed close to the skin surface, while others penetrate several millimeters deeper before being scattered or absorbed. This difference determines which blood vessels contribute to the measurement and, ultimately, which physiological parameter can be extracted.
LED Color | Wavelength | Approximate Penetration Depth | Primary Tissue Interaction |
Blue | 450–495 nm | 0.3-0.8 mm | Epidermis |
Green | 520–560 nm | 1-3 mm | Superficial capillaries |
Yellow | 570–590 nm | 2-3 mm | Dermis |
Red | 620–680 nm | 3-6 mm | Dermis |
IR | 880-940 nm | 6-8 mm | Deeper blood vessels |

Green LEDs have become the workhorse of wearable heart-rate monitoring. Since they interact strongly with the superficial capillaries just beneath the skin, they produce a large pulsatile signal while consuming relatively little power. That's why almost every smartwatch and fitness band relies on green LEDs for continuous heart-rate tracking.
Red and infrared LEDs take a different approach. Instead of focusing on superficial vessels, they penetrate deeper into the tissue, making them ideal for blood oxygen saturation (SpO₂) measurements. By comparing how oxygenated and deoxygenated blood absorb these two wavelengths, the wearable can estimate arterial oxygen saturation.
Rather than choosing one wavelength over another, most modern optical modules combine green, red, and infrared LEDs into a single package, allowing one sensing module to support multiple health-monitoring features. Changing the LED color doesn't just change what you can measure, it also changes the hardware around it.
Different wavelengths require different LED drive currents, have different optical efficiencies, and generate different amounts of heat. As more LEDs are added, the optical module becomes more complex, requiring additional drivers, careful timing control, and tighter power management to maintain battery life without compromising signal quality.
How Far Apart Should the LED and Photodiode Be?
If there's one-dimension engineers spend far more time optimizing than most people realize, it's the distance between the LED and the photodiode.
Move them a little too close, and the photodiode starts "seeing" the LED instead of the blood beneath the skin.
Move them too far apart, and hardly enough light makes its way back to the detector.
Finding the correct spot is one of the biggest challenges in optical sensor design. When the LED and photodiode are positioned very close together, some of the emitted light takes the shortest possible path—it travels directly from the LED into the photodiode without ever entering the skin. This phenomenon is known as optical crosstalk.
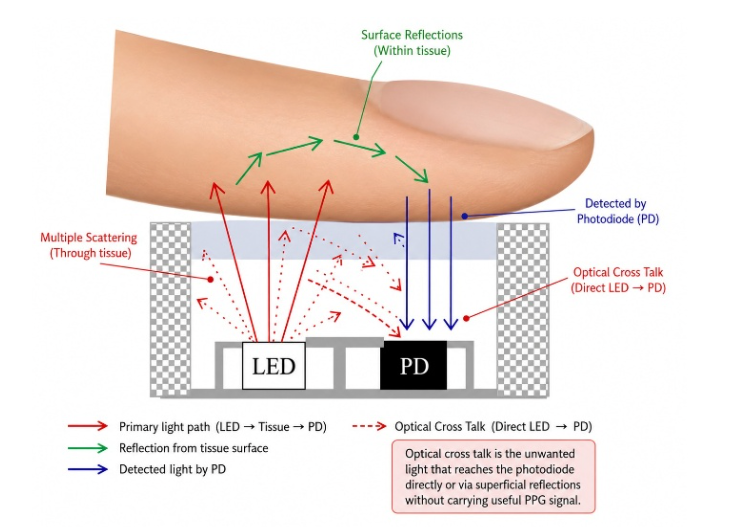
The photodiode still receives light, but unfortunately, it's the wrong light. Since it hasn't interacted with blood or tissue, it carries almost no physiological information. The result is a weaker pulsatile signal and a lower signal-to-noise ratio (SNR).
Naturally, the first instinct is to move the components further apart. And to some extent, that works. A larger separation encourages more light to travel through the tissue before returning to the photodiode, increasing the useful physiological signal. But like most things in engineering, there is a trade-off.
As the distance increases, light has to travel a longer path through biological tissue, where it is continuously scattered and absorbed. Eventually, fewer photons make it back to the detector, forcing the LEDs to operate at higher currents to compensate. Higher LED currents mean greater power consumption, more heat, and reduced battery life.
So, the goal isn't to maximize the spacing. It's to find the optimum optical path for the intended application. Although there is no universal "correct" distance, wearable products generally fall within the design ranges shown below.
LED | Wavelength | Typical Separation from PD | Why? |
Green | 525–560 nm | 3–5 mm | Strong interaction with superficial capillaries provides excellent SNR while keeping optical crosstalk low. |
Red | 660 nm | 4–6 mm | Slightly larger spacing allows photons to interact with deeper blood vessels before returning to the detector. |
Infrared (IR) | 880–940 nm | 4–7 mm | Deeper tissue penetration benefits from a longer optical path while maintaining adequate reflected light. |
These values should be viewed as engineering starting points rather than fixed rules. The final spacing depends on the sensor package, cover glass thickness, enclosure design, optical barriers, PCB thickness, and even the body location where the device will be worn.
This is why commercial optical modules are rarely designed using calculations alone. Most manufacturers rely on optical simulations followed by multiple rounds of prototype testing before finalizing the geometry.
The optical module should never be treated like a standard PCB component that can simply be moved around to create more routing space. Its position often dictates the surrounding PCB layout. A few millimeters saved during layout can easily cost weeks of signal optimization later. In many wearable projects, the optical module is one of the very first components to be placed, with the remaining electronics arranged around it rather than the other way around.
Practical PCB Design Considerations for PPG Sensor
Keep the AFE as close as possible to the optical sensor. The shorter the photodiode signal path, the lower the chance of noise pickup and parasitic capacitance affecting the measurement.
Keep photodiode traces short, direct, and isolated. Treat these traces like sensitive analog signals. Avoid routing them alongside high-speed clocks, SPI lines, or switching power supplies.
Use wider traces for the LED drive paths. Unlike the photodiode, LEDs carry relatively high currents. Wider traces reduce voltage drop and help distribute current more efficiently, while the photodiode routing should prioritize short, clean signal paths over trace width.
Maintain a solid ground plane. A continuous ground beneath the optical circuitry traces provides a stable return path and helps shield the sensitive analog front end from digital noise.
Keep noisy components away. Bluetooth antennas, crystal oscillators, and high-speed digital interfaces all generate electromagnetic noise. Giving the optical module a little breathing room can significantly improve signal quality.
Think about heat, not just space. MCUs, PMICs, and battery chargers all generate heat. Placing them immediately beside the optical sensor can change LED characteristics and influence local tissue temperature, causing subtle measurement drift during long monitoring sessions.
Design the PCB around the optical module, not the other way around. The optical sensor, optical cover, and optical barrier must all align precisely. Treat the sensing module as a complete subsystem during floor planning instead of squeezing it into the remaining space after everything else has been placed.
Measuring the Heart Electrically: Why ECG Changes the Design Game
While PPG measures changes in blood volume using light, Electrocardiography (ECG) takes a completely different approach. Instead of looking at blood flow, ECG measures the tiny electrical signals generated every time the heart beats.
Each heartbeat begins with an electrical impulse that travels through the heart muscle, causing it to contract and pump blood throughout the body. These electrical signals travel through body tissues and can be detected by electrodes placed on the skin. By measuring the voltage difference between two electrodes, wearables can reconstruct the familiar ECG waveform consisting of the P wave, QRS complex, and T wave.

Because ECG measures the heart's electrical activity directly, it provides valuable information beyond heart rate. A single lead ECG recording can be used for heart rate (HR), heart rate variability (HRV), rhythm analysis, atrial fibrillation (AFib) detection, and when combined with PPG, enables measurements such as Pulse Transit Time (PTT).
ECG doesn't have the luxury of strong signals. Wearable ECG systems are trying to capture electrical signals that are only a few hundred microvolts to a few millivolts in amplitude. At these levels, even small amounts of electrical noise, poor electrode contact, or PCB layout mistakes can significantly affect signal quality.
Why Most Wearables Use Single-Lead ECG
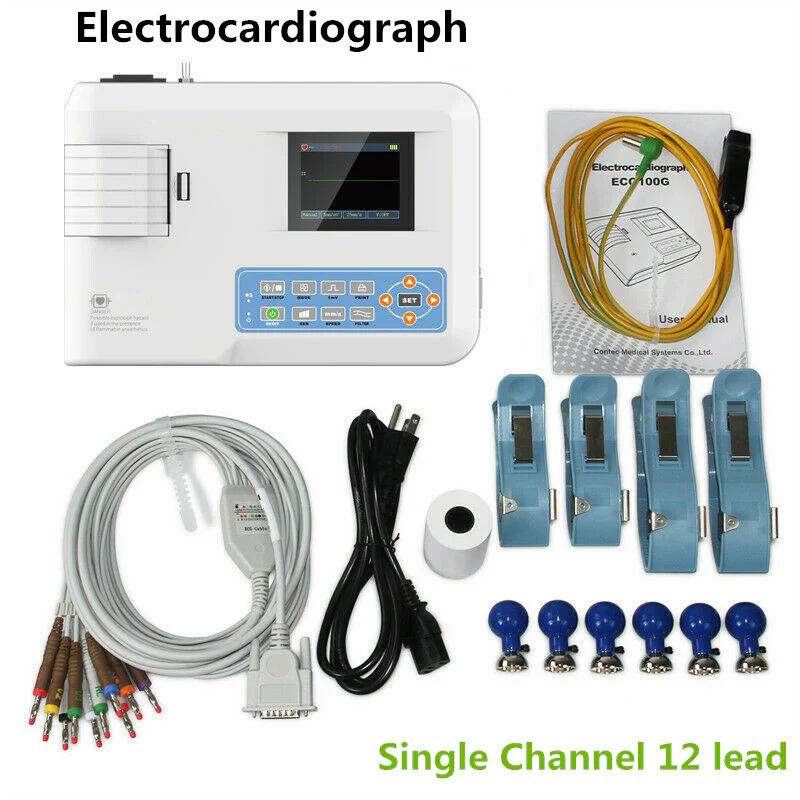
If you've ever seen a hospital ECG machine, you've probably noticed the number of electrodes attached to the patient. A standard clinical ECG uses 10 electrodes to generate 12 leads, providing multiple views of the heart's electrical activity. This is ideal for diagnosing a wide range of cardiac conditions but isn't exactly practical for a smartwatch or a smart ring.
That's why most wearable devices use single-lead ECG.
In a smartwatch, one electrode is usually integrated into the back of the watch, remaining in contact with the wrist, while the second electrode is placed on the bezel or side button. When the user touches the second electrode with the opposite hand, a complete electrical circuit is formed across the upper body, allowing the watch to record a Lead I equivalent ECG.
Smart rings follow a similar principle. One electrode maintains contact with the finger, while another electrode is touched using the opposite hand or another finger to complete the measurement. Chest patches, on the other hand, can continuously record ECG because both electrodes remain attached to the chest throughout the measurement.
Although single-lead ECG cannot replace the diagnostic capability of a clinical 12-lead system, it is more than capable of supporting many wearable health applications while maintaining a compact, comfortable form factor.
Why ECG Sensor Placement Matters
Unlike PPG, where light simply needs to reach blood vessels beneath the skin, ECG measures the voltage difference between two electrodes. This means the placement and spacing of those electrodes directly influence the quality of the recorded signal.
Clinical systems benefit from larger electrode spacing because they capture a greater portion of the heart's electrical field, resulting in larger signal amplitudes and clearer waveforms.
Wearables, however, don't have that luxury.
A smart band has only a few centimeters between its electrodes, while a smart ring has even less. This smaller spacing naturally reduces signal amplitude, making the ECG waveform more susceptible to motion artifacts, electromagnetic interference, and variations in skin contact. In other words, shrinking the device doesn't just make the PCB smaller; it also makes capturing a clean ECG significantly more challenging.
Designing wearable ECG hardware is less about adding electrodes and more about protecting an extremely sensitive analog signal from the moment it enters the device until it reaches the Analog Front End (AFE).
Unlike digital signals, ECG cannot tolerate much electrical interference. Every millimeter of unnecessary routing, every noisy switching traces placed nearby, and every poorly planned return path has the potential to reduce signal quality before the waveform is even amplified.
This is why the PCB layout becomes just as important as the electrode design itself.
PCB Layout Considerations for ECG Sensor
Place the Analog Front End (AFE) as close as possible to the ECG electrodes. Keeping the analog signal path short minimizes parasitic capacitance and reduces the opportunity for noise pickup before amplification.
Route the ECG inputs as closely coupled, length-matched differential traces. Since ECG measures the voltage difference between two electrodes, both traces should experience the same electrical environment. This allows the AFE to maximize its Common Mode Rejection Ratio (CMRR) and reject unwanted common-mode noise.
Keep analog traces short and direct while minimizing unnecessary vias. Every additional via or long trace introduces parasitic effects and increases the possibility of electromagnetic interference.
Maintain a continuous ground plane. A clean ground reference provides a stable return path and helps shield the sensitive analog front end from nearby digital switching noise.
Protect the AFE with appropriate input filtering and ESD protection. Since the electrodes are directly exposed to the user, input protection improves both device reliability and robustness against electrostatic discharge.
Conclusion
Designing a wearable is about much more than selecting the right sensor. It's about understanding where and how that sensor should interact with the human body. As we've explored through PPG and ECG, sensor placement influences everything from signal quality and measurement accuracy to PCB layout, power consumption, mechanical design, and the overall user experience
However, PPG and ECG are only part of the wearable sensing ecosystem. Modern devices rely on a combination of sensing technologies, each with different physiological requirements and ideal body locations. Understanding these differences is essential for designing wearables that perform reliably in real-world conditions.
In the next blog, we'll shift our focus to IMUs, skin temperature sensing, and sleep monitoring, exploring how body location influences their performance and how these requirements shape the hardware, mechanical design, and overall architecture of next-generation wearable devices.
References:
Olli Tikkanen, PhD, CEO. (2025, April 24). Where to wear a wearable? how sensor placement ... LinkedIn. https://www.linkedin.com/pulse/where-wear-wearable-how-sensor-placement-shapes-olli-dzfre
Soroudi, A., Hernández, N., Berglin, L., & Nierstrasz, V. (2019). Electrode placement in Electrocardiography Smart Garments: A review. Journal of Electrocardiology, 57, 27–30. https://doi.org/10.1016/j.jelectrocard.2019.08.015
Castaneda D, Esparza A, Ghamari M, Soltanpur C, Nazeran H. A review on wearable photoplethysmography sensors and their potential future applications in health care. Int J Biosens Bioelectron. 2018;4(4):195-202. doi: 10.15406/ijbsbe.2018.04.00125. Epub 2018 Aug 6. PMID: 30906922; PMCID: PMC6426305.
Charlton, P.H. and Marozas V. Wearable Photoplethysmography Devices. In Photoplethysmography; Kyriacou, P.A., Allen, J., Eds.; Elsevier, 2021.
Adrian. (2026, April 17). PPG Optical Path and Process Design for Wearable Devices. AllElectroHub. https://www.allpcb.com/allelectrohub/ppg-optical-path-and-process-design-for-wearable-devices
PPG ID recommendations - chest patch wearables | Analog Devices. Analog Devices. (n.d.). https://www.analog.com/en/resources/design-notes/ppg-id-recommendations--chest-patch-wearables.html
What Can a Single Lead ECG Actually Detect?. Science Insights. (2025, November 19). https://scienceinsights.org/what-can-a-single-lead-ecg-actually-detect/


Comments